Fast and Accurate Emulation of the SDO/HMI Stokes Inversion with Uncertainty Quantification
Richard E.L. Higgins1, David F. Fouhey1, Dichang Zhang1, Spiro K. Antiochos2, Graham Barnes3, Todd Hoeksema4, KD Leka3, Yang Liu4 Peter W. Schuck2, Tamas I. Gombosi5
1U. Michigan CSE, 2 NASA GSFC,
3 NorthWest Research Associates Boulder,
4 Stanford University,
5 U. Michigan CLASP
Accepted to the Astrophysical Journal. Arxiv Link
Poster at AGU 2020, ML in Space Weather. AGU Link
Presented at COSPAR2021, Workshop on ML for Space Sciences. YouTube Link
Posted as an HMI Nugget. HMI Nugget Link
Code on Github. https://github.com/relh/FAE-HMI-SI
Introduction. Our paper presents a neural network trained to estimate the sun's magnetic field. It learns to predict parameters describing the magnetic field of the sun at the photosphere using polarized light measurements (I, Q, U, and V) captured at 6 wavelengths by the Helioseismic and Magnetic Imager (HMI) onboard the Solar Dynamics Observatory (SDO).
Our system is trained to emulate an existing system, the Very Fast Inversion of the Stokes Vector (VFISV). This inversion code depends on a forward model, known as the Milne-Eddington model, which maps parameters describing the sun's photosphere to expected observations of polarized light, as IQUVs. Due to the Zeeman Effect, the magnetic field influences the wavelengths that one expects to see. VFISV aims to invert this forward model by finding parameters that the forward model thinks would match the actual observations at each pixel. This takes ~30 minutes per disk, since it requires solving millions of optimization problems.
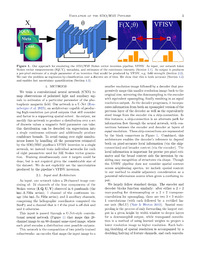
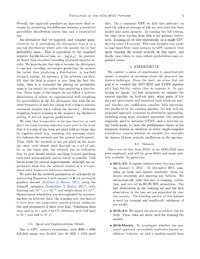
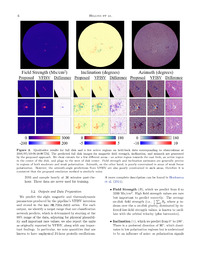
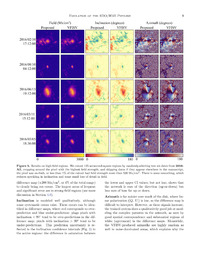
Our system is trained to emulate this mapping, and converts IQUV observations to magnetic field outputs. In particular, the system aims to predict eight targets (described on this page). Look at the four targets and predictions below to see if you can tell the difference between them!


Meet the Targets. Now that you've seen some examples, lets talk more about what these parameters are. Cumulatively, the values for these parameters (plus others that are held constant for SDO/HMI) define the polarized light we expect to see.
- Field (Mx/cm2) — the strength of the magnetic field
- Inclination (degrees) — the inclination angle of the magnetic field, measured in degrees.
- Azimuth (degrees) — the azimuth angle of the magnetic field, measured in degrees.
- LOS Velocity (cm/s) — the velocity of the plasma in the line-of-sight of the telescope, measured in cm/s.
- Doppler Width (mÅ) — a thermodynamic parameter, measured in milli angstroms.
- η0 (dimensionless) — a thermodynamic parameter, dimensionless.
- S0 (Data Number/s) — a thermodynamic parameter.
- S1 (Data Number/s) — a thermodynamic parameter.
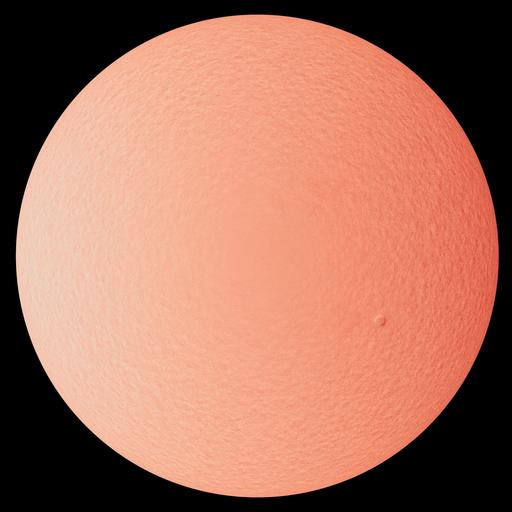
You can see these parameters below across the full disk, with both predictions and VFISV outputs. Data that our network has not seen (a dataset we call 2016-all). is available for all eight targets at the click of the play button or drag of a slider. See if you can learn to identify differences between the ground truth and predicted images!


Spot the difference! Solar disks for the entirety of 2016 are loaded into the below web-viewer, but the labels got shuffled by a cosmic ray. I am an overloaded researcher with no time! I need you to figure out which one is which! Mouse-over the blue solar disk below to see zoom-in panels on the left and right side. For each timestamp, one is our system's predictions and the other is VFISV output. If you figure out which is which, please send me an email at relh@umich.edu! In the meantime I'll be in the lab running more experiments.

Accepted to the Astrophysical Journal. Arxiv Link
Poster at AGU 2020, ML in Space Weather. AGU Link
Presented at COSPAR2021, Workshop on ML for Space Sciences. YouTube Link
Code on Github. https://github.com/relh/FAE-HMI-SI
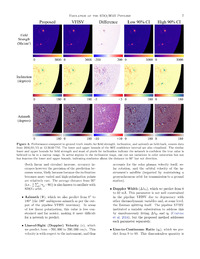
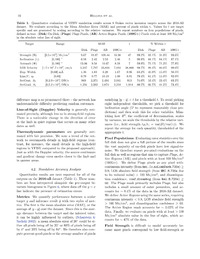
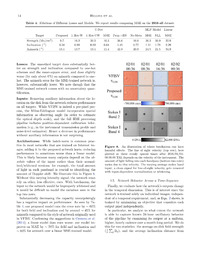
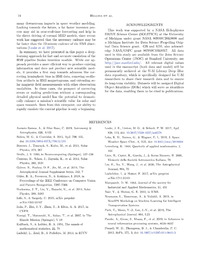
Applications. We hope to use this system both as a fast "quick-look" version of VFISV and as a tool for troubleshooting artifacts seen in VFISV's output. For example, there appears to be a 24-hour, periodic tendency affecting in the average of Sun's magnetic field strength over the entire disk. However, this is suspicious since the sun probably doesn't have 24-hour periodicity, but our satellite observing it definitely has!
Here images taken every hour for the two weeks of February are shown, alongside a graph tracking the average field strength of the result of VFISV and our emulation. Each of these images corresponds to a point on the graph! Since our system can produce full disks in a matter of seconds, it's promising that the above strange 24 hour oscillation could be addressed by inverting lots of data quickly and looking closely.

|

|

|
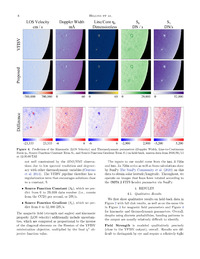
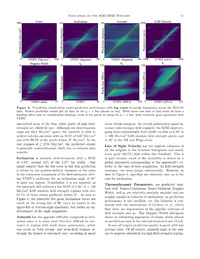
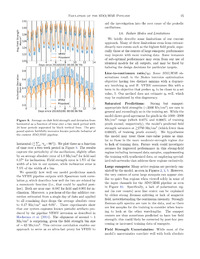
Some Lessons Learned. In many problems using Internet images, the inputs are unitless since the images are the result of enormous amounts of post-processing. In our problem, the absolute values of the units are crucial and so standard techniques that apply normalization per input (e.g., Batch-Norm) destroy this information.
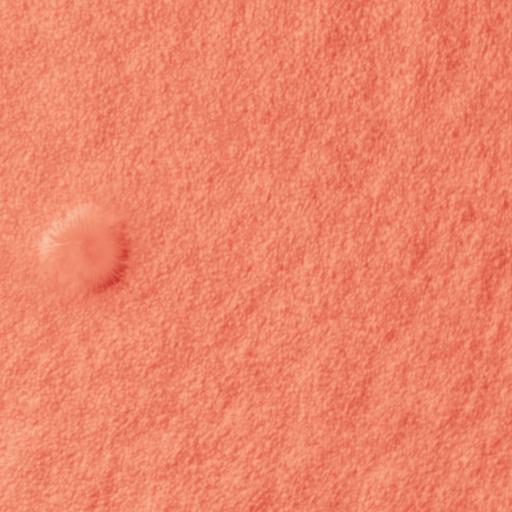
We show a relatively simple demonstration of this below for LOS Velocity. As SDO moves towards and away from the Sun, the amount of light received at each of the six wavelengths changes. This is also reflected in the line-of-sight velocity of the plasma. You can move one hour forwards and backwards and see how the time of day affects both the input (IQUV) and output (velocity). Watch how the darkest tile on the input changes over the day and how that corresponds to a change in overall value on the right; this is easiest to see in I. Can you see it in Q, U, and V?
| 00:00 | |||||||||
| Input: IQUV | Output: LOS Velocity | ||||||||
| ← Wavelengths → | Cutout | Full Disk | |||||||
| I |  |  |  |  |  |  |
|
 | |
| Q |  |  |  | 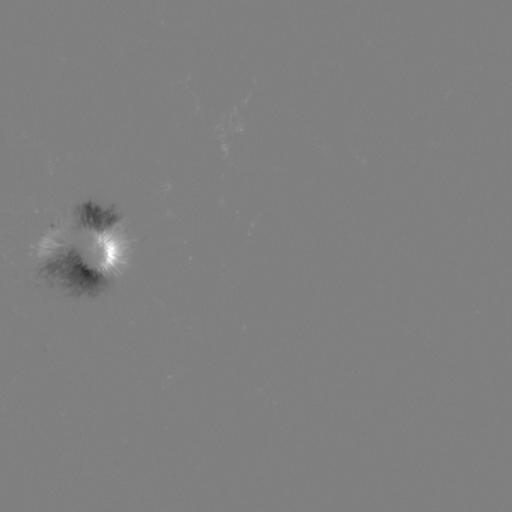 | 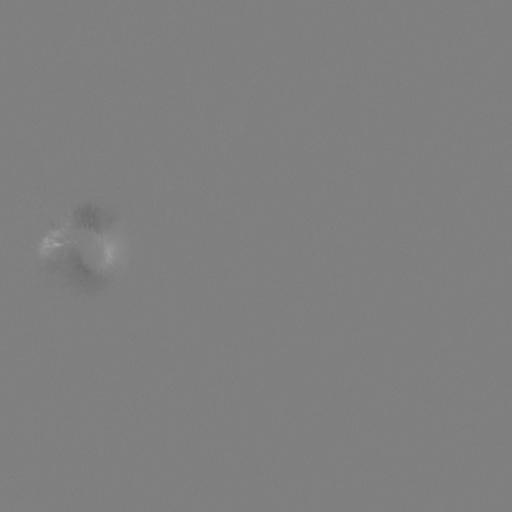 | 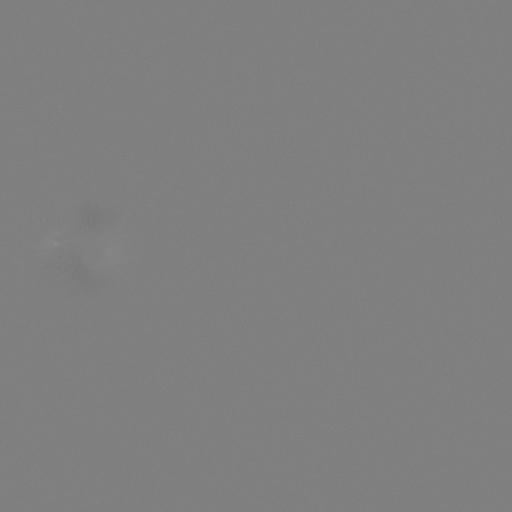 | |||
| U | 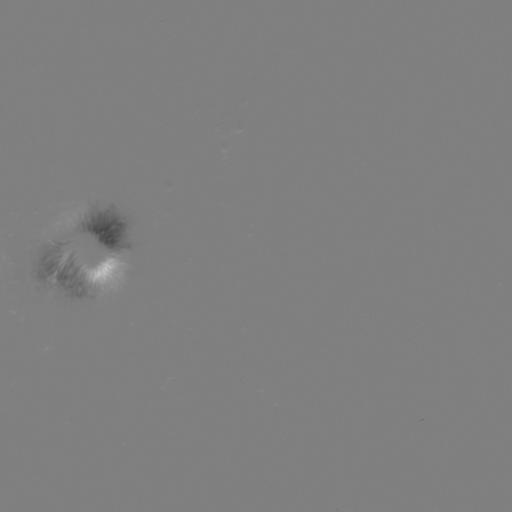 |  |  |  |  |  | |||
| V |  |  |  |  |  |  | |||

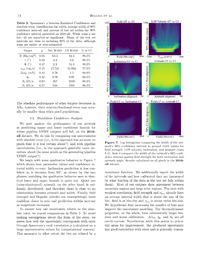
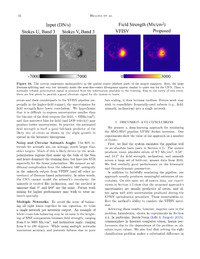
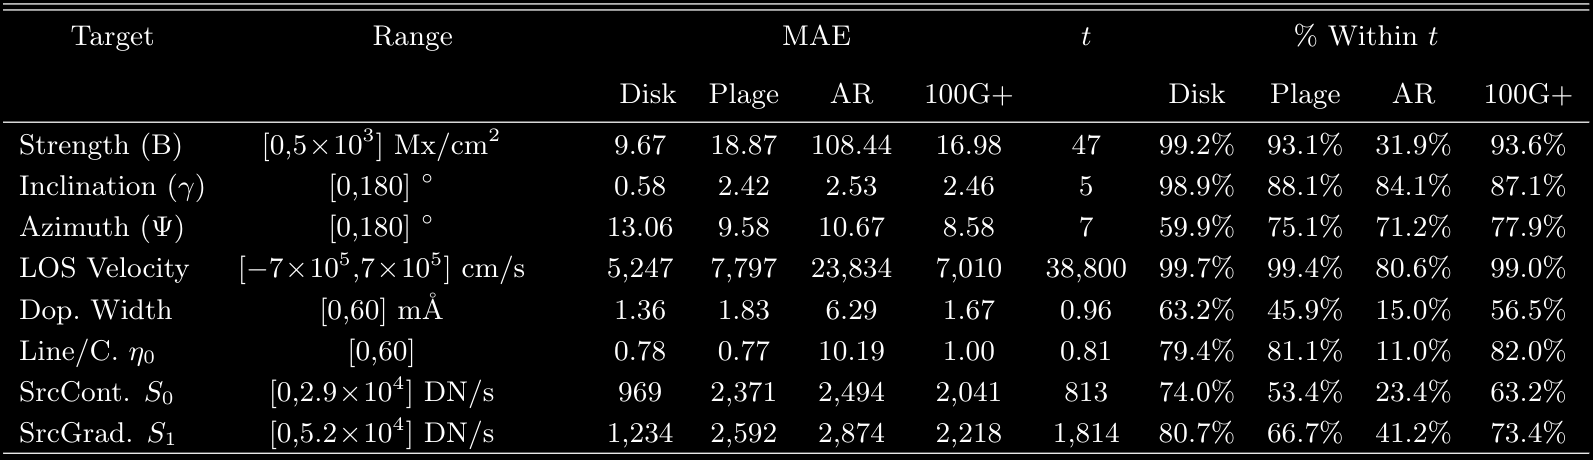
Quantitative Results. Although the above comparisons give one an alright understanding of qualitative performance, we need to evaluate performance across various regions of interest on the solar disk.
As such, we create a series of masks for every image. These masks cover all on-disk pixels (Disk), plage pixels (Plage), active region pixels (AR), and pixels with at least 100 Mx/cm2 in the absolute value of the plasma velocity in the line of sight (100+).
Evaluation is conducted using the Mean Absolute Error (MAE) and percent of pixels within t. Values for t are target specific and are generated by scaling according to the relative variances. We find that the model reproduces the VFISV output to a high degree of fidelity.
Conclusions. In summary, we have presented in this paper a deep-learning approach for fast and accurate emulation of the HMI pipeline Stokes inversion module. While our approach provides a more efficient way to produce existing information and does not produce new scientific models, it provides a first step towards advances like correcting hemispheric bias in HMI data, removing oscillation artifacts in HMI magnetograms, and extending solar magnetic field measurements with other observation modalities. In these cases, the prospect of correcting errors or making predictions without a corresponding detailed physical model has the potential to dramatically enhance a mission’s scientific value for solar and space research. Seen from this viewpoint, our ability to rapidly emulate the current pipeline is only a beginning.